Genome-wide off-target cleavage prediction of CRISPR/Cas nucleases
During this project, we predicted the collateral effects (off-targeting) of CRISPR/Cas nucleases. This project responded to the growing interest in genome editing using RNA-guided nucleases (RGNs), particularly Cas9. We can estimate the collateral cleavage sites based on a model from statistical physics.
Model explanation
In our model, we assume that R-loop formation occus in a lineair fashion from seed to end: first the first nucleotide binds (R1), then the second (R2), then the third (R3) etc. The possibility of going to the next state depends on the forward rate kf. It is also possible to go back and unwinde the R-loop (from R3 to R2, for instance). That probability depends on the backward rate kb.
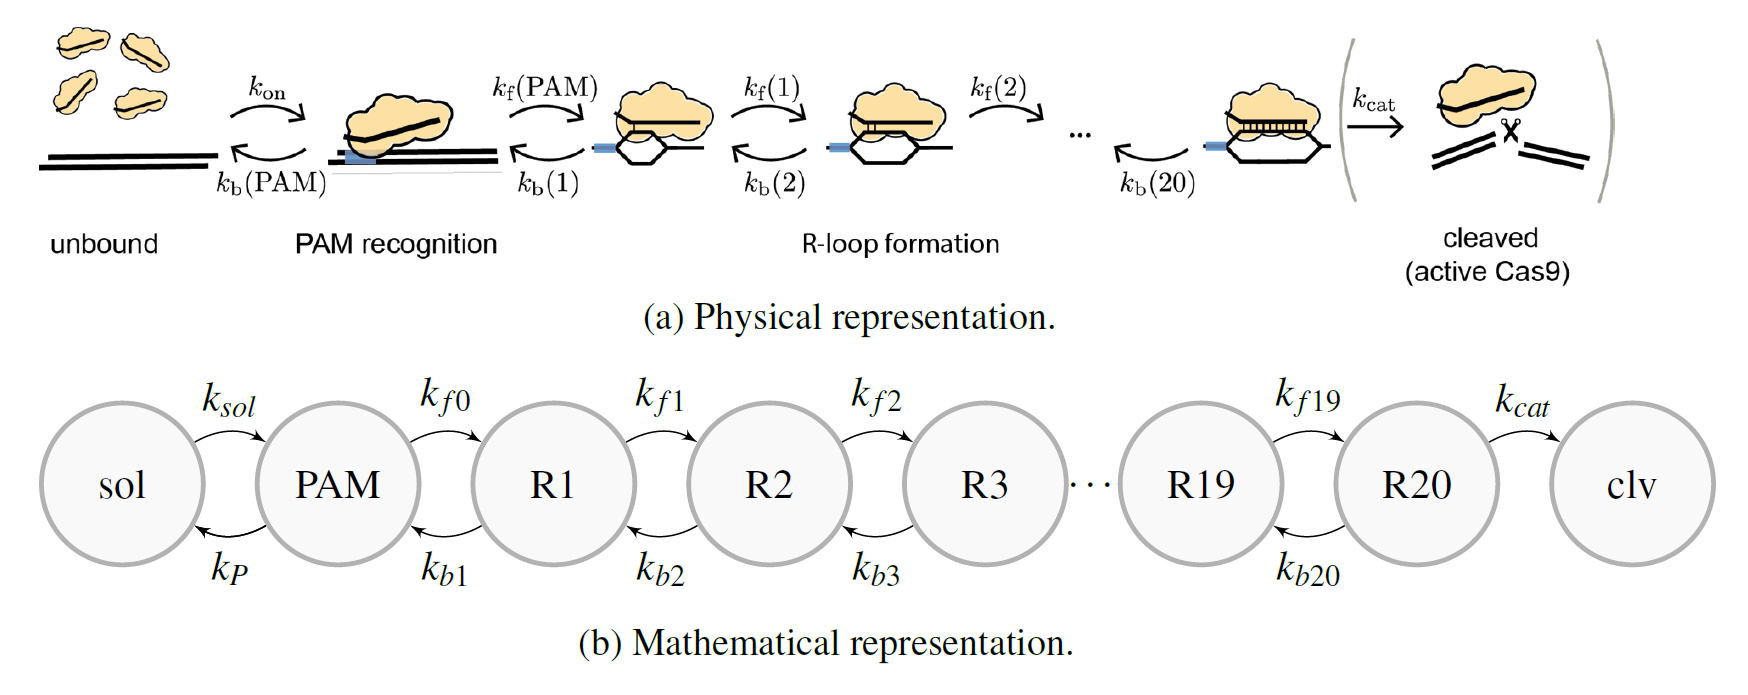
Transition Rate Matrix
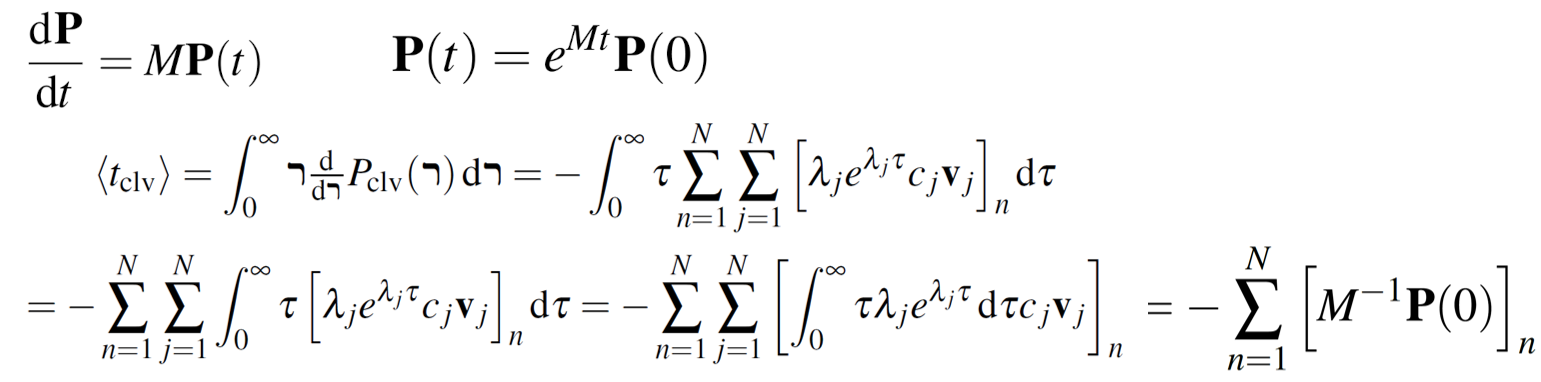
The above model can be represented by a set of first-order, homogeneous, lineair differential equations with constant coefficients, which is usually reffered to as the the Master equation. Please, read this document (chapter 2) for the precise definition of the transition rate matrix M and its eigenbase expansion.
The transition rates were fitted with the Metropolis-Hastings algorithm using high-throughput biochemical profiling data from other labs.
Supercomputer Code Structure
With high performance computing clusters (HPCs, ‘supercomputers’), we applied this model for whole-genome prediction. More precisely, we calculated the average cleavage time for all possible target sites of length 20. The genomic data was stored in HDF5 files.
Model evaluation
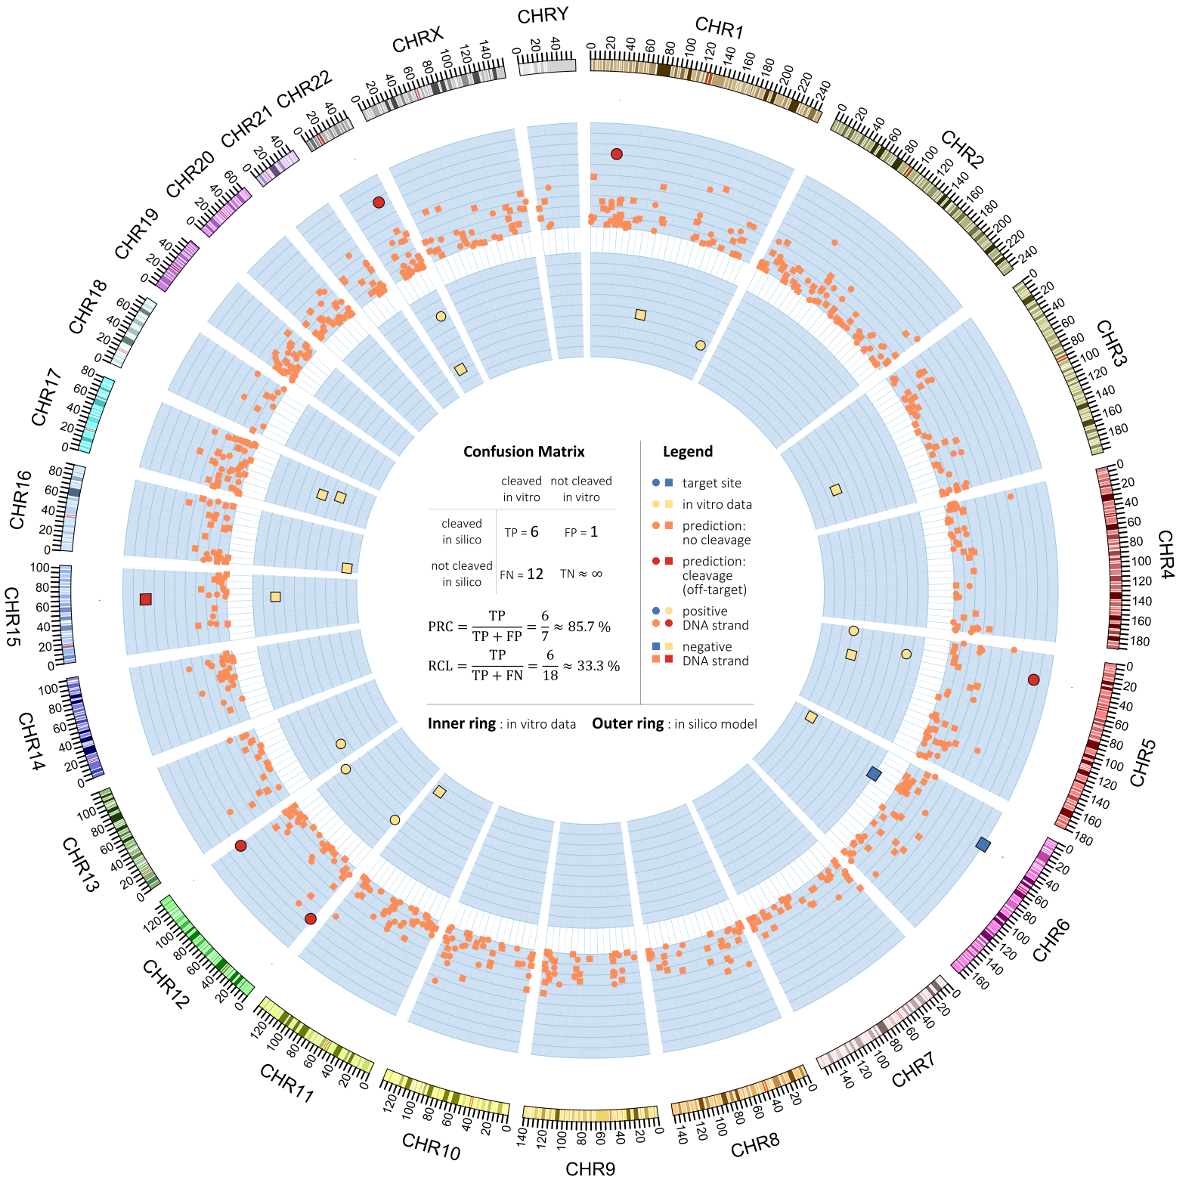
Since the biochemical validation data from other labs was binary (cleavage or not), we had to ‘downgrade’ our model to a binary classifier by picking a threshold for the predicted cleavage time.
The figure below visualises a comparison of the in vitro validation set (inner ring) and the in vitro predicted set. In the middle, a confusion table is calculated based on the threshold that optimised the F1 score. The figure also nicely displays the data before the binary conversion. For a complete explanation, I refer to this document, chapter 4.
Sawtooth PR curves
Further evaluation was performed using precision recall curves. Interestingly, they all displayed a sawtooth pattern. We can explain this with a fictional dataset displayed below.
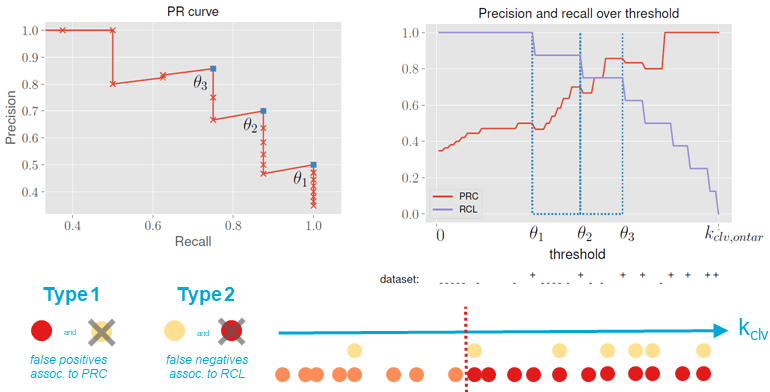
Pick three arbitrary consecutive cleavage rates θ1 < θ2 < θ3 that are all chosen from the test set. In other words, they all correspond to an off-target site and there is no off-target with a kclv between them. If θ increases in the range [θ1;θ2), RCL(θ) cannot change because the threshold will not pass any off-targets. Only false-negatives can be converted to true negatives, increasing PRC(θ). When θ = θ2, the RCL(θ) and PRC(θ) will drop at once, because a true positive is changed into a false negative. If θ grows further in the range [θ2;θ3), only PRC(θ) is affected again. This will result in a sawtooth.
Want to learn more?
Please, feel free to contact me for questions. I am also happy to give presentations. The complete project report can be found here.
Terug naar Biotech